
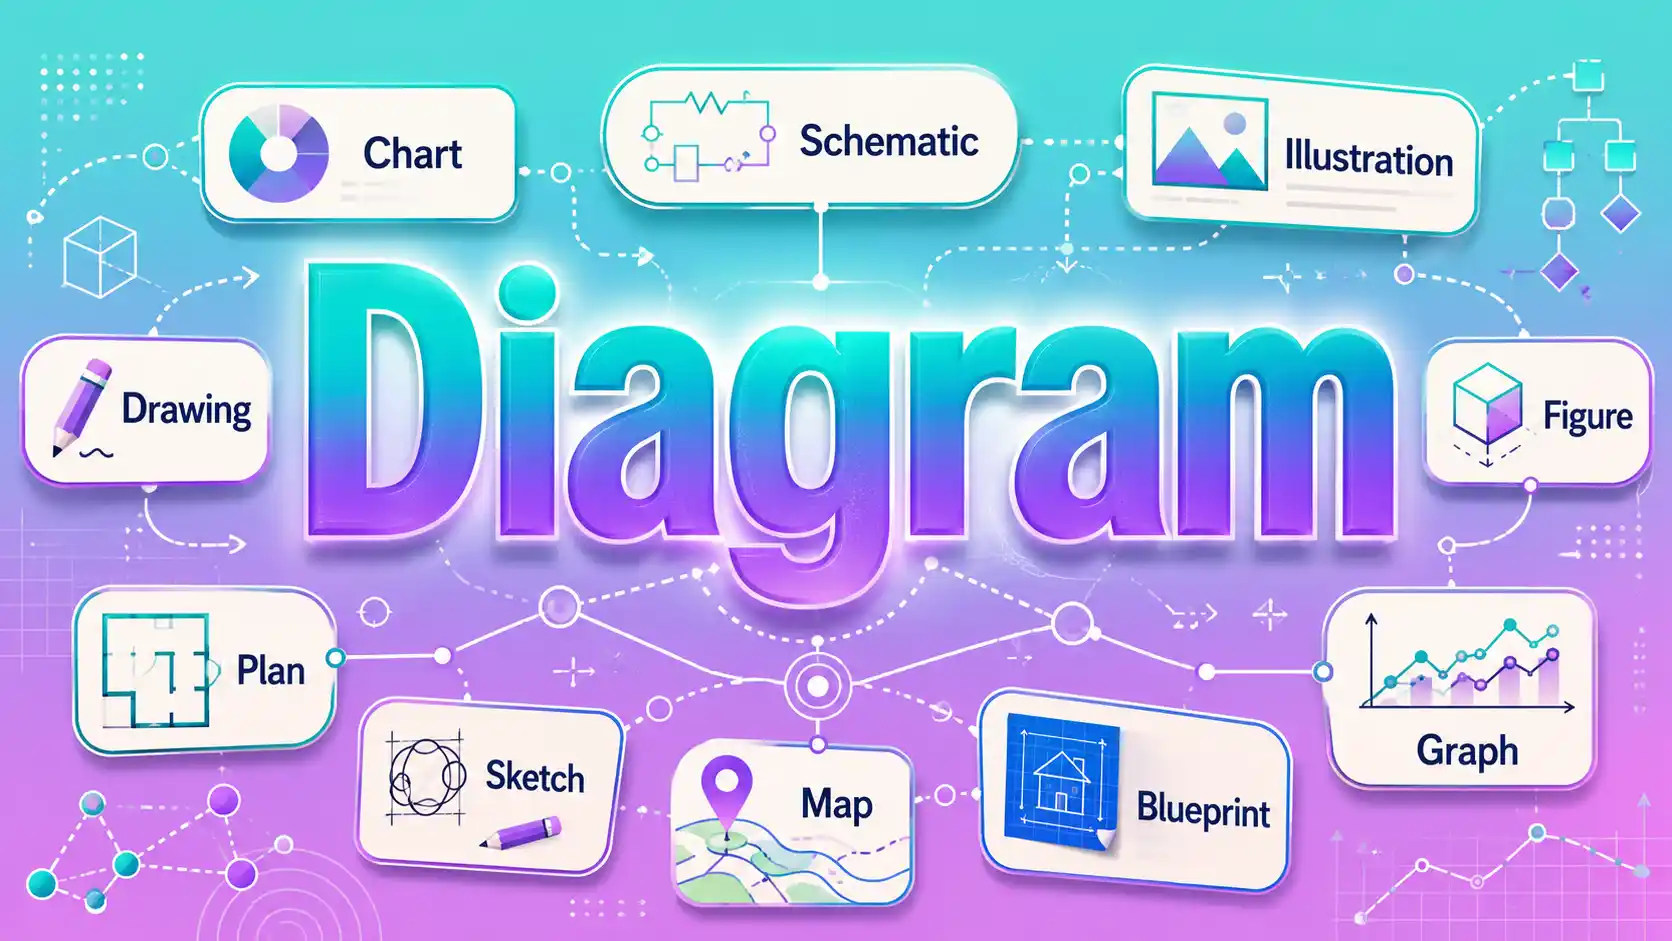
Synonyms for diagram include chart schematic illustration drawing and figure. A diagram is a visual representation that uses lines, shapes , symbols or labels to explain how something looks, works or connects.
The best synonym depends on what the visual shows and how formal the context is. For example a schematic usually explains technical connections while a chart often organizes information or data.
In the sentence “The engineer studied the diagram of the circuit” schematic is a natural replacement because the image shows technical relationships.
10 Best Synonyms for Diagram and Their Meanings
| Synonym | Simple Meaning |
| Chart | A visual display of information |
| Schematic | A simplified technical drawing |
| Illustration | A picture used to explain something |
| Drawing | An image made with lines or marks |
| Figure | A labeled visual in a document |
| Plan | A drawing showing structure or arrangement |
| Sketch | A simple or rough drawing |
| Map | A visual showing locations or relationships |
| Blueprint | A detailed technical plan or design |
| Graph | A visual display of numerical relationships |
What Are Synonym of Diagram ?
Synonyms for diagram are words for visual representations that explain information structure relationships or processes. However they are not always interchangeable.
A graph normally presents data, a schematic shows technical connections and a sketch may simply show an object’s appearance. The best choice depends on what the diagram contains, why it was created and how formal the writing is.
Quick Facts About Diagram
Word: Diagram
Part of Speech: Noun
Simple Meaning: A visual that explains something with lines shapes symbols or labels
Pronunciation: /ˈdaɪ.əˌɡræm/
Syllables: 3
Origin: From Greek diagramma meaning something marked out or drawn
Formality: Neutral; often formal or academic in technical contexts
Common Uses: Everyday explanation academic writing professional writing technical documents
Example Sentence: The teacher drew a diagram to show how the water cycle works.
Diagram Meaning and Usage
The basic meaning of a diagram is a drawing or visual representation used to explain information. Unlike a decorative picture a diagram usually has a practical purpose. It helps readers understand structure relationships, movement order or operation.
A diagram may contain:
- Lines connecting related ideas
- Boxes showing stages
- Arrows showing direction
- Labels identifying parts
- Symbols representing objects or actions
- Shapes showing position or structure
For example a biology textbook may contain a diagram of a plant cell. A computer technician may use a network diagram. A business team may study a process diagram showing how an order moves from purchase to delivery.
Diagram as a General Visual
In its broadest sense the diagram can describe many explanatory visuals.
Example:
The diagram shows the main parts of the machine.
Here words such as illustration figure drawing or schematic may work depending on the visual.
Diagram as a Technical Visual
In engineering electronics architecture and computing a diagram often represents relationships rather than realistic appearance.
Example:
The technician checked the wiring diagram before starting the repair.
In this context schematic is often more precise than drawing.
Diagram as a Process Visual
A diagram can also show steps or movement through a system.
Example:
The process diagram explains how customer requests are approved.
Here flowchart process map workflow diagram or flow diagram may be better alternatives.
Tone and Formality
The diagram has a neutral tone. It sounds natural in everyday explanations but is also common in academic and professional writing.
“Look at this diagram” sounds normal in a classroom while “Figure 2 contains a diagram of the system architecture” fits formal technical writing.
Detailed Analysis of Diagram Synonyms
1. Chart
Relationship: Near synonym
Meaning: A visual way of presenting information categories, measurements or relationships.
Difference: A chart usually organizes information or data. A diagram may explain structures, systems objects or processes more broadly.
Best Used For: Data comparisons schedules categories and organized information.
Example: The chart compares monthly rainfall in five cities.
2. Schematic
Relationship: Near synonym
Meaning: A simplified drawing showing how the parts of a system connect or operate.
Difference: A schematic is normally technical and does not try to show an object exactly as it appears.
Best Used For: Electronics engineering machinery networks and technical systems.
Example: The electrician reviewed the schematic before checking the circuit.
3. Illustration
Relationship: Near synonym
Meaning: A picture or visual used to explain or support information.
Difference: An illustration can be realistic, artistic or decorative while a diagram is usually more explanatory and structured.
Best Used For: Textbooks manuals articles educational materials and presentations.
Example: The illustration helps readers identify each part of the flower.
4. Drawing
Relationship: Near synonym
Meaning: A picture created using lines, shapes or marks.
Difference: Drawing is much broader. A drawing can be artistic and may not explain anything while a diagram normally communicates information.
Best Used For: General visual descriptions, plans designs and informal explanations.
Example: She made a drawing showing where each shelf should go.
5. Figure
Relationship: Near synonym
Meaning: A numbered or labeled visual included in a book paper report or presentation.
Difference: Figure describes the role of a visual in a document. A figure may be a diagram, photograph graph or chart.
Best Used For: Academic papers research reports manuals and textbooks.
Example: Figure 4 shows the structure of the proposed system.
6. Plan
Relationship: Contextual alternative
Meaning: A drawing that shows the arrangement design or intended structure of something.
Difference: A plan usually focuses on how something is arranged or will be built. A diagram can explain many other kinds of information.
Best Used For: Buildings rooms sites machinery and projects.
Example: The architect showed us a plan for the new classroom.
7. Sketch
Relationship: Contextual alternative
Meaning: A simple or quickly made drawing showing the basic form of something.
Difference: A sketch is often rough or incomplete. A diagram is usually organized specifically to communicate information.
Best Used For: Early ideas, informal explanations, design work and rough layouts.
Example: He drew a quick sketch of the proposed desk arrangement.
8. Map
Relationship: Contextual alternative
Meaning: A visual showing locations, positions, routes or relationships.
Difference: A map normally represents space or location although conceptual maps can also show relationships between ideas.
Best Used For: Geography routes websites systems and conceptual relationships.
Example: The map shows the route from the station to the museum.
9. Blueprint
Relationship: Contextual alternative
Meaning: A detailed technical design showing how something should be built or organized.
Difference: A blueprint is normally a construction or design document. The diagram is much broader.
Best Used For: Architecture engineering construction and detailed planning.
Example: The builders checked the blueprint before installing the stairs.
10. Graph
Relationship: Contextual alternative
Meaning: A visual showing relationships between numbers or variables.
Difference: A graph is a specific type of visual usually involving data. Not every diagram is a graph.
Best Used For: Mathematics statistics science economics and data analysis.
Example: The graph shows how temperature changed during the experiment.
11. Flowchart
Relationship: Contextual alternative
Meaning: A diagram that uses boxes, arrows or symbols to show steps in a process.
Difference: A flowchart specifically represents sequence decisions or workflow.
Best Used For: Procedures algorithms business processes and decision paths.
Example: The flowchart explains what happens after a customer submits a request.
12. Layout
Relationship: Contextual alternative
Meaning: A visual showing how elements are arranged in a space or design.
Difference: A layout focuses on position and arrangement rather than explaining relationships or operations.
Best Used For: Rooms websites publications interfaces and design projects.
Example: The designer created a layout for the new homepage.
13. Outline
Relationship: Contextual alternative
Meaning: A simplified representation showing the main structure or important parts.
Difference: An outline can be written rather than visual. When used visually it normally shows only the basic structure.
Best Used For: Simple plans, organizational structures and introductory explanations.
Example: The document includes an outline of the proposed network structure.
14. Graphic
Relationship: Near synonym
Meaning: A visual element used to communicate information.
Difference: Graphic is broader and can include decorative images, icons, photographs, charts and diagrams.
Best Used For: Websites presentations marketing publishing and digital communication.
Example: The graphic summarizes the main stages of the recycling process.
15. Representation
Relationship: Near synonym
Meaning: Something that shows or stands for an object idea system or relationship.
Difference: Representation is more abstract. It can refer to words, models, symbols, images or diagrams.
Best Used For: Academic scientific mathematical and analytical writing.
Example: The model provides a simplified representation of the transportation network.
16. Visualization
Relationship: Near synonym
Meaning: A visual presentation designed to make information easier to understand.
Difference: A visualization may be interactive or computer-generated and often focuses on data or complex information.
Best Used For: Data analysis research dashboards presentations and computing.
Example: The visualization makes changes in population easier to compare.
17. Schema
Relationship: Contextual alternative
Meaning: An organized representation of a system structure or set of relationships.
Difference: Schema is more technical and abstract than diagram. It is especially common in computing databases and conceptual modeling.
Best Used For: Databases information systems research and conceptual structures.
Example: The database schema shows how the tables are connected.
18. Model
Relationship: Contextual alternative
Meaning: A simplified representation of how an object idea or system works.
Difference: A model can be physical, mathematical, digital or conceptual. A diagram is specifically visual.
Best Used For: Science engineering education economics and system design.
Example: The model explains how information moves through the network.
19. Plot
Relationship: Contextual alternative
Meaning: A graphical display showing values or relationships in data.
Difference: A plot is much narrower than a diagram and normally belongs to mathematics, statistics or science.
Best Used For: Data scientific results mathematics and statistics.
Example: The plot shows a clear relationship between speed and distance.
20. Infographic
Relationship: Contextual alternative
Meaning: A visual that combines graphics, short text symbols and data to explain information.
Difference: An infographic usually presents several pieces of information in a designed format. A diagram may show only one structure or relationship.
Best Used For: Education websites report social media and public information.
Example: The infographic explains how household water is used.
21. Process Map
Relationship: Contextual alternative
Meaning: A visual showing the stages actions and responsibilities in a process.
Difference: A process map focuses specifically on workflow rather than general visual explanation.
Best Used For: Business operations quality control project management and training.
Example: The process map shows how an online order reaches the shipping team.
22. Flow Diagram
Relationship: Contextual alternative
Meaning: A visual showing how something moves from one stage or location to another.
Difference: It emphasizes movement sequence or flow rather than static structure.
Best Used For: Processes engineering systems energy transfer and information flow.
Example: The flow diagram shows how water moves through the filtration system.
23. Concept Map
Relationship: Contextual alternative
Meaning: A visual showing connections between ideas or concepts.
Difference: A concept map is designed specifically to organize knowledge and relationships between ideas.
Best Used For: Education brainstorming studying planning and research.
Example: We created a concept map connecting the main causes of climate change.
24. Mind Map
Relationship: Contextual alternative
Meaning: A branching visual that organizes ideas around one central topic.
Difference: Mind maps normally develop outward from a central idea while diagrams can follow many different structures.
Best Used For: Brainstorming studying note-taking and planning.
Example: Her mind map organized the topics she needed to review for the exam.
25. Workflow Diagram
Relationship: Contextual alternative
Meaning: A visual showing tasks and their order within a workflow.
Difference: It is narrower than diagram because it focuses on work activities and their sequence.
Best Used For: Business procedures software development operations and project management.
Example: The workflow diagram shows which department approves each request.
Diagram Synonyms by Context
Everyday Conversation
For normal explanations the most natural alternatives are:
- Drawing — when describing a simple visual
- Picture — when precise technical meaning is not important
- Sketch — for something quick or rough
- Chart — for organized information
- Map — when showing locations or routes
“Picture” can work conversationally but it is broader than diagram and is not usually a precise synonym in technical writing.
Formal Writing
Useful choices include:
- Figure
- Illustration
- Representation
- Schematic
- Plan
Figure is especially common when referring to numbered visuals in reports.
Academic Writing
Strong alternatives include:
- Figure
- Representation
- Visualization
- Schema
- Graph
The best choice depends on the discipline. Researchers often label any visual as a figure but the visual itself may specifically be a graph diagram or chart.
Business Communication
Common choices include:
- Chart
- Process map
- Flowchart
- Workflow diagram
- Visualization
For example a team explaining how a customer request moves through several departments would usually use flowchart or process map rather than illustration.
Technical Writing
Useful terms include:
- Schematic
- Blueprint
- Plan
- Schema
- Flow diagram
Technical writers should choose the most specific term possible.
Process Diagram Synonyms
When diagram describes a process strong alternatives include:
- Flowchart
- Process map
- Flow diagram
- Workflow diagram
- Process flowchart
These are more precise than general terms such as drawing or illustration.
If you need synonyms for the word process itself rather than process diagram, possible alternatives include procedure method workflow sequence and system depending on meaning.
Synonyms for Graph
A graph is one particular kind of diagram. Depending on context alternatives for graph include:
- Chart
- Plot
- Diagram
- Figure
- Visualization
Use plot mainly for mathematical or scientific data while chart is more general.
Diagram Synonym Starting With S
A strong diagram synonym starting with S is schematic.
A schematic is a simplified technical diagram showing parts and their connections.
Example: The engineer examined the schematic of the electrical system.
Diagram Synonym With 9 Letters
Schematic has 9 letters and is one of the strongest answers for a nine-letter diagram synonym.
It is especially appropriate for technical electronic mechanical or engineering diagrams.
Exact vs. Similar Synonyms for Diagram
Few words are exact replacements for diagram in every situation. Illustration and drawing are close in general meaning but both can describe visuals that do not explain anything. Chart often organizes data while graph specifically shows numerical relationships. Schematic is more technical and focuses on connections between parts.
Context therefore matters more than simply choosing a word listed in a thesaurus. In an engineering manual schematic may be the most accurate choice. In a research paper the figure may sound more natural. In a business meeting a process diagram might be called a flowchart or process map. Choosing the precise term makes the purpose of the visual clearer.
Diagram Antonyms and Contextual Opposites
Diagram does not have a true dictionary antonym because it names a type of visual representation rather than a quality with a direct opposite. However the following terms can function as contextual contrasts when distinguishing visual information from nonvisual information.
| Contextual Opposite | Meaning | Example Sentence |
| Text | Information presented in written words | The instructions are given as text rather than a diagram. |
| Prose | Ordinary written language | The report explains the system in prose instead of visually. |
| Verbal description | An explanation expressed in words | She gave a verbal description rather than drawing a diagram. |
| Written explanation | Information explained through sentences | The manual provides a written explanation beside the diagram. |
| Narrative | Information presented as a connected account | The author uses a narrative instead of a visual representation. |
| Raw data | Unprocessed facts or measurements | The analyst received raw data before creating the diagram. |
| Unstructured information | Information without a visual organization | The notes were unstructured information until the team created a diagram. |
Common Collocations With Diagram
| Phrase | Meaning | Example Sentence |
| Detailed diagram | A diagram containing many specific parts | The manual includes a detailed diagram of the engine. |
| Simple diagram | A diagram designed to be easy to understand | The teacher used a simple diagram to explain the idea. |
| Labeled diagram | A diagram whose parts have names | Students studied a labeled diagram of the human heart. |
| Schematic diagram | A technical visual showing connections | The schematic diagram shows how the components are connected. |
| Circuit diagram | A visual representation of an electrical circuit | The technician checked the circuit diagram for errors. |
| Process diagram | A visual showing stages in a process | The process diagram explains how applications are reviewed. |
| Venn diagram | Overlapping circles showing relationships between groups | We used a Venn diagram to compare the two stories. |
| Block diagram | A visual using blocks to represent system components | The block diagram gives an overview of the computer system. |
Diagram Words Example
Words commonly used when talking about diagrams include label arrow box line symbol shape connection stage section component flow and structure.
For example:
“The arrows in the diagram show how information moves between the different components.”
These words are not synonyms for diagram. Instead they describe common parts or features of diagrams.
FAQ
What is a synonym for the word diagram ?
A strong synonym for diagram is chart although the best alternative depends on context. Schematic works well for technical diagrams illustration for explanatory pictures, figures for academic documents and flowchart for processes.
What are 5 good synonyms for diagram ?
Five good synonyms or close alternatives are chart schematic illustration drawing and figure. These words overlap with the diagram but they are not identical. For example a schematic is usually technical while an illustration may be more realistic or artistic.
What is a diagram in simple words?
A diagram is a picture that explains information. It often uses lines, shapes , arrows, labels or symbols to show how something is built, connected, arranged or carried out.
What is similar to a diagram?
A chart graph schematic illustration map flowchart or plan can be similar to a diagram. The right word depends on what the visual communicates. A graph shows data while a flowchart shows steps or decisions.
Conclusion
Choosing the right synonym for diagram makes your writing more precise. Words such as chart schematic illustration figure and flowchart describe different kinds of visuals.
Always consider what the visual shows who will read it and whether the situation is everyday academic professional or technical.

About Sajjad Ahmed
Sajjad Ahmed is the author behind Guest Paster, where he writes about English vocabulary, synonyms, word meanings, and practical word usage.
His content is designed to help readers understand the differences between similar words, discover suitable alternatives, and use English vocabulary more effectively in everyday writing and communication.
Before publishing, Sajjad focuses on presenting word choices in a clear and easy-to-understand format, with relevant meanings, context, and examples where helpful.
Through Guest Paster, his goal is to make vocabulary learning simpler and provide useful language resources for students, writers, English learners, and anyone looking to expand their vocabulary.
Areas of Focus: English Vocabulary • Synonyms • Word Meanings • Word Usage • Language Learning
Author: Sajjad Ahmed
Website: Guest Paster